← Back to home
04 / Selected work

The work behind the numbers.

Seven write-ups: what the situation was, what I did, what changed, and why it matters. Two of them are real roles; the rest are master's work I chose to treat like client engagements.

CASE / 01

Finding the real variable

59%
Band 7 attainment
Up from 27%, same cohort
8.5 vs 4
Tutor-student ratio
Spanish & French vs. other subjects
1 in 10
Finished band 5 or below
Down from 1 in 3
Context

As Academic Program Coordinator at IB Tutoring Australia, I owned student-outcome analysis across 50+ IB subjects. I'd also tutored four of them myself, including Spanish, where I was the company's first tutor.

What I did

The signal came from Spanish, a subject I know deeply, so weak results there didn't sit right. I pulled the outcome data across cohorts and found the same shape in the language subjects: the problem tracked with tutor-to-student ratios, not student ability. Spanish and French were carrying around 8.5 students per tutor against roughly 4 elsewhere. I wrote it up for management with a specific fix: reallocate two tutors to the stretched language subjects, refresh their materials, and add subject-specific tutor guides.

Result

Management implemented the changes. For that same cohort, top-band (band 7) attainment across Spanish and French rose from 27% at their mid-year trial exams to 59% at their November finals, and the share finishing at band 5 or below fell from about a third to roughly one in ten. The one-off analysis became a recurring, program-wide data-review process.

Why it matters

It's how I work everywhere: notice what doesn't fit, ask why before deciding what to do, and let the data point to the real lever, then hand back something a team can act on.

CASE / 02

Building the system that moved the throughput

50%
Throughput gain
vs the 30-case benchmark
45+
Cases resolved / day
Peaking at 60
Lowest
Escalation-rate band
Held on the team
Context

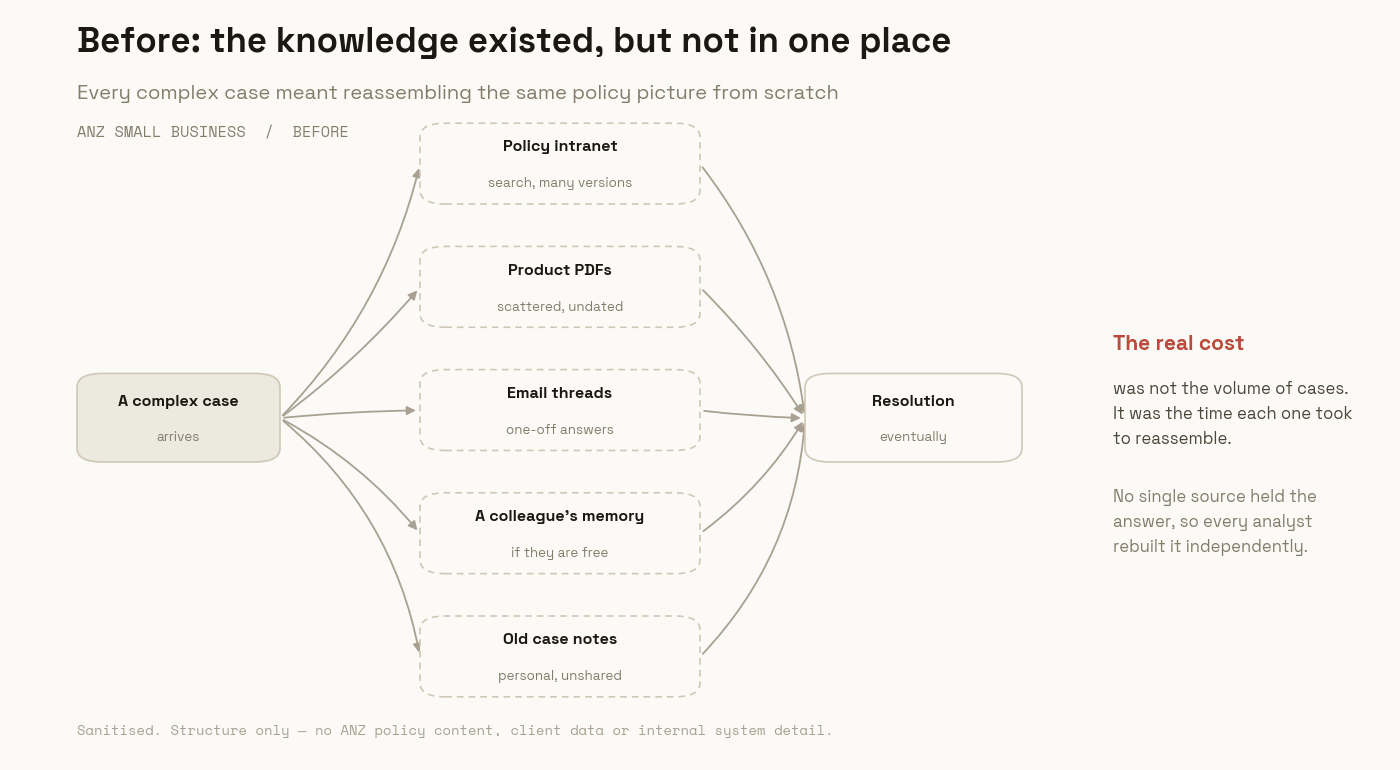
At ANZ I resolved small-business client cases in a regulated banking environment, where every resolution has to be correct, compliant, and defensible on audit. Four months in, KPI targets rose from a 30-case daily benchmark toward 45+. The volume wasn't the real problem — the real cost was the time each case took, because the policy and process knowledge needed to resolve them lived in people's heads and across scattered sources.

What I did

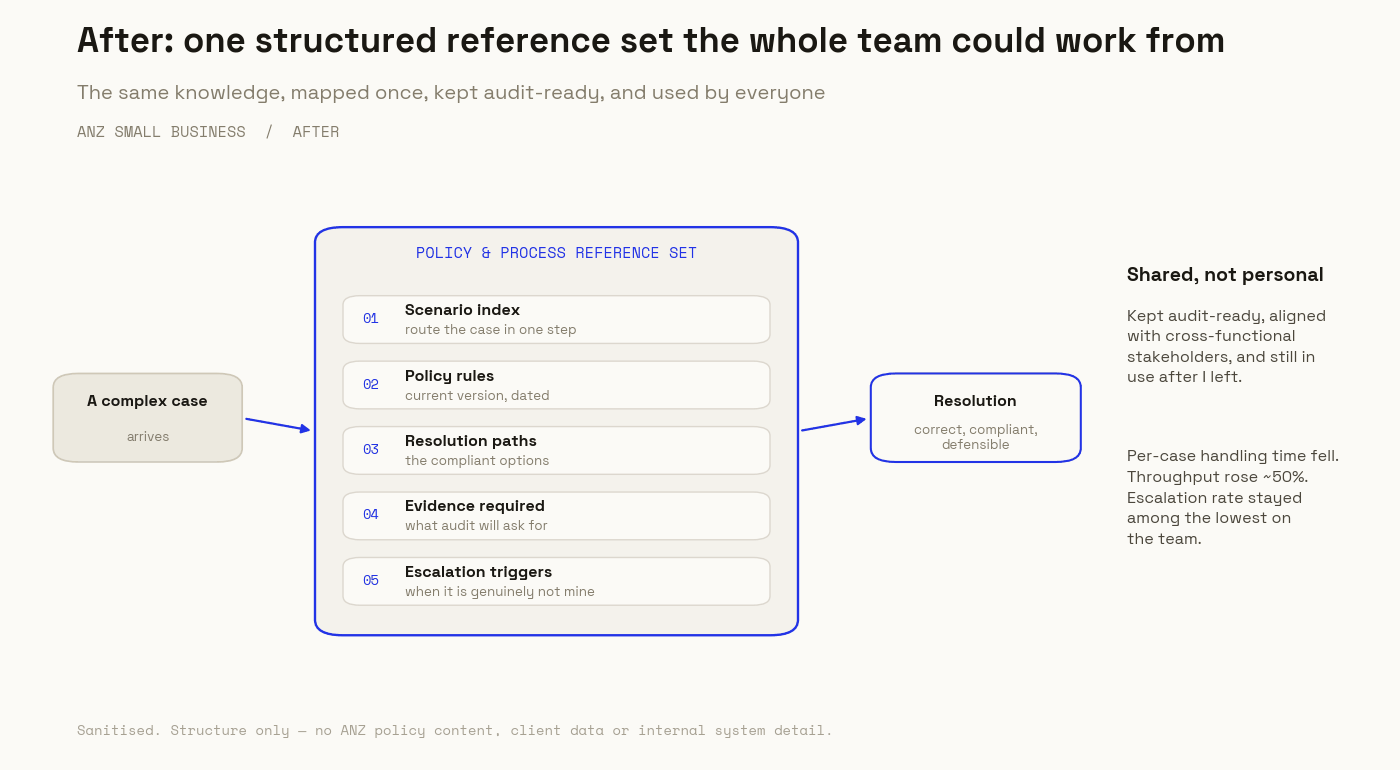
I treated it as an analysis problem before a speed problem. I mapped where handling time actually went, then built a working reference set of policy and process notes, a single, structured source that standardised how complex scenarios got resolved and sharpened which cases to prioritise. I kept the documentation audit-ready and engaged cross-functional stakeholders to align on compliant resolutions, so the reference set held up under governance, not just at my own desk.

Result

Per-case handling time fell and throughput rose to 45+ cases a day, peaking at 60, roughly a 50% increase on the original benchmark, while I held one of the lowest case-escalation rates on the team and sustained accuracy as volume climbed. The reference set became shared infrastructure: structured documentation that supported knowledge transfer across the team, not a personal shortcut.

Why it matters

This is the PMO half of how I work. Finding the real lever is step one; the value is in turning it into a repeatable system with the governance, documentation, and stakeholder alignment that lets other people rely on it. Process improvement that survives an audit and outlives the person who built it.

CASE / 03

Did the engagement shape the disruption, or explain it?

$1.6B
Caulfield–Dandenong LXRP
Noble Park trader precinct, 2016–2018
17%
Rail users aware of engagement
Before construction began
5
Recommendations delivered
From outcome evaluation to a cross-agency director role
Context

A 9,866-word group investigation for BUSM4415 (Industry Project Investigation) into stakeholder engagement on the $1.6B Caulfield to Dandenong Level Crossing Removal Project, focused on construction disruption for traders in Noble Park's Douglas & Ian Street precinct between 2016 and 2018.

What I did

Ran a qualitative, triangulated desk case study against one sharp research question, did engagement genuinely shape how disruption was managed, or mainly justify decisions already made, drawing on the VAGO audit, the EY Sweeney pre-construction sentiment survey of 144 traders, and the Area 2 and 3 Stakeholder Liaison Group summaries.

Result

Found four linked weaknesses: high engagement activity but only 17% pre-construction awareness among rail users, engagement front-loaded before construction and weakest during the disruption itself, no measurement of commercial impact on traders, and community-outcome accountability split from authority over delivery decisions. The clearest evidence of what was left unresolved: a $3.5M trader revitalisation package committed three years after completion. We delivered five recommendations, including an outcome-oriented evaluation framework and a unified cross-agency Community Outcomes Director role.

Why it matters

Engagement is easy to measure by activity count and easy to get wrong that way. I know how to separate genuine influence on decisions from documentation of decisions already made, and to turn that gap into recommendations a delivery authority could actually implement.

Figures
CASE / 04

Model the number, then try to break it

13.68%
Project IRR
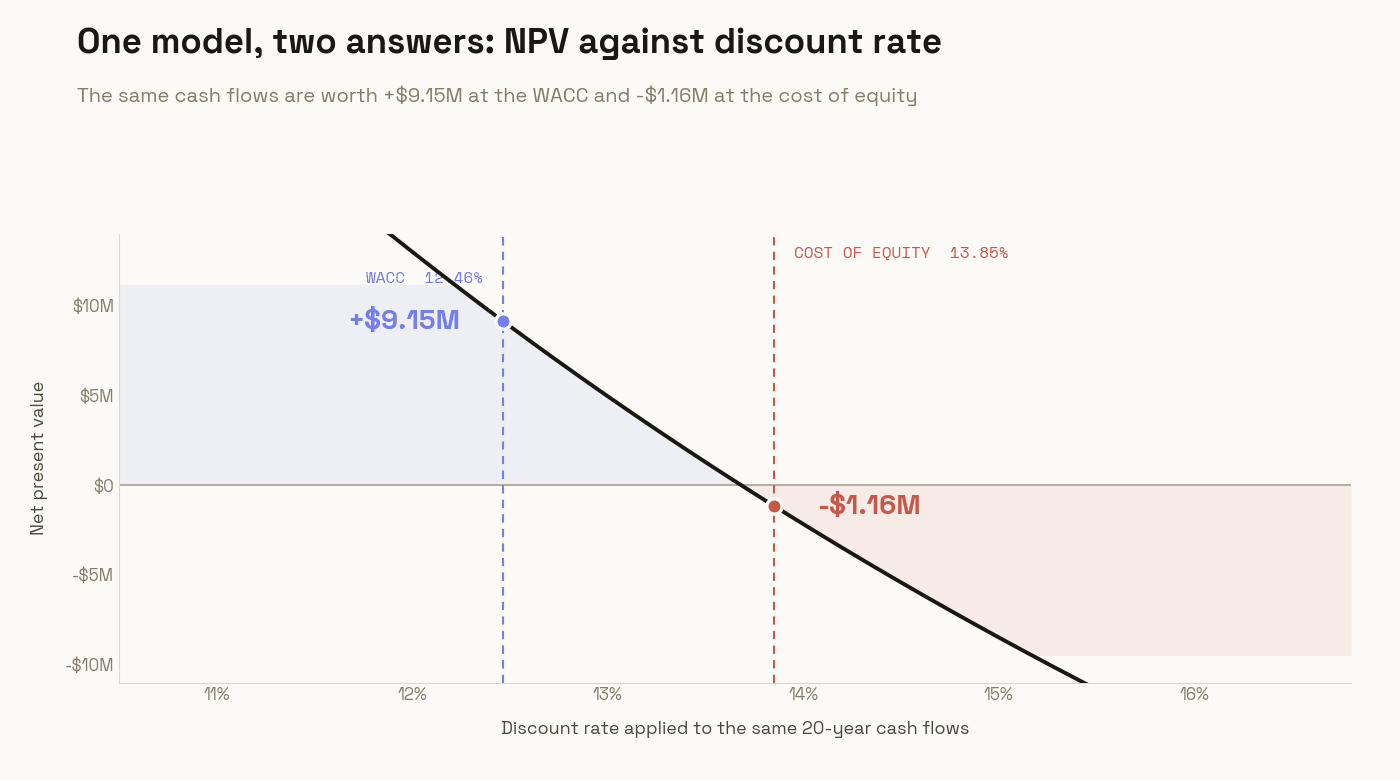
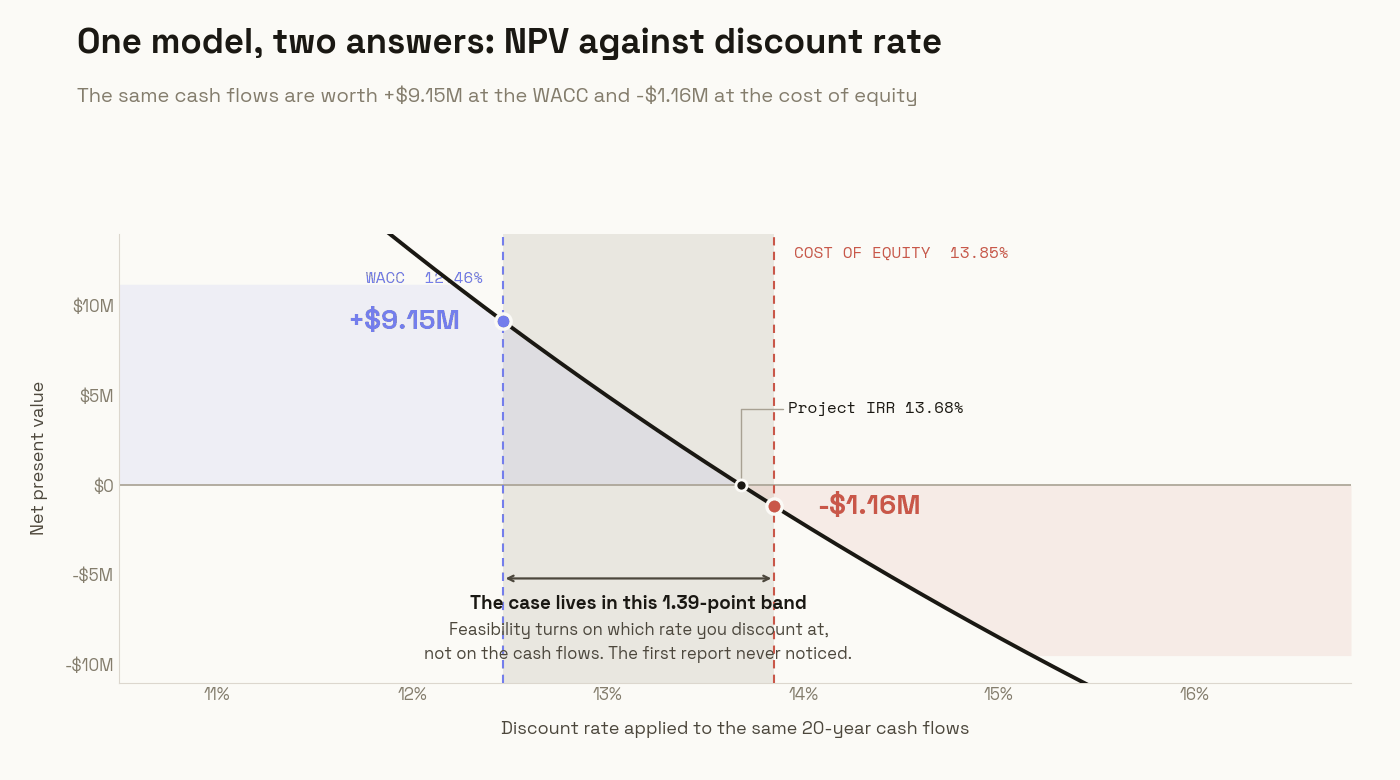
Sits between the 12.46% WACC and the 13.85% CAPM hurdle
-$1.16M
NPV at the cost of equity
+$9.15M at WACC, the sign turns on the discount rate
79%
Probability of a negative NPV
10,000-run Monte Carlo, ±5% revenue and ±10% costs
Context

Two linked reports for the Board of Directors of ABC Pty Ltd, written for BUSM4417 (Project Financial Management & Appraisal) and BUSM1276 (Evaluating and Managing Project Risk), on a Build-Operate-Transfer water-treatment facility: $85M capex, a 20-year concession, financed 75% debt at 12% against 25% equity, with revenue locked in through three offtake contracts.

What I did

Built the full 20-year model in Excel first, cash flows, loan amortisation, NPV, project and equity IRR, WACC, CAPM, DSCR and interest cover, then wrote a second report whose job was to attack it. That second pass found the first one had discounted at the wrong rate, so I restated the NPV, re-ran the coverage ratios year by year, put a 10,000-iteration Monte Carlo over the revenue and cost assumptions, and stress-tested the corrected base case across five risk categories, pairing each with a specific mitigation: EPC contract caps, take-or-pay clauses, debt sculpting and a debt service reserve account.

Result

The project IRR came out at 13.68%, which falls between the 12.46% WACC and the 13.85% CAPM cost of equity. That single fact decides the case: discounted at WACC the NPV is +$9.15M, discounted at the cost of equity it is -$1.16M. Feasibility turned on a methodological choice rather than on the cash flows, and the first report had made that choice without noticing it. The Monte Carlo put the probability of a negative NPV at 79%, with a 5th to 95th percentile range of -$3.5M to +$1.3M. Debt coverage was the sharper finding: average DSCR of 2.14 across the concession, but 0.76, 0.84 and 0.93 in years one to three, so the project cannot service its own debt from operating cash flow until year four. I recommended proceeding only with sculpted repayments, a reserve account sized to the shortfall, and monitoring through the ramp-up.

Why it matters

Board-level appraisal isn't finished when the base case is positive. It's finished when someone has gone back at the model hard enough to find what the first pass got wrong, and has said so. Catching my own error and restating the recommendation is the part of this I'd bring to a business case or investment paper.

Figure
CASE / 05

Structure without control: the myki governance gap

$136.8M
Cost increase
18-month delay against ~$2.8B lifetime cost
6
Organisations benchmarked
Across federal, state & local tiers
2012 → 2028
Contactless timeline gap
London 2012, Sydney 2017, Melbourne delayed to 2028
Context

An individual 4,100-word report for BUSM2654 (Public Sector Project Management) comparing PM maturity across Australia's three government tiers, paired with group work benchmarking Melbourne's myki contactless-ticketing modernisation against the global leaders, using an Investment Logic Map, benefits-realisation framing, and PRINCE2, and drawing on the Victorian Auditor-General's 2026 findings.

What I did

Assessed six organisations against a P3M3-style maturity lens (ATO vs. NDIA at federal, Transport for NSW vs. Victoria's DTP at state, two councils at local), then built the Investment Logic Map for the $1.96B, 15-year myki contract, mapping drivers, problems, benefits and required changes against VAGO's audit of why known delivery risk was accepted at contract signing instead of resolved.

Result

DTP ran an effective strategy and tender process but didn't resolve known schedule risk before awarding the contract, producing an 18-month standstill and a $136.8M cost increase. Contactless ticketing wasn't the problem, London proved it in 2012 and Sydney staged it from 2017. The failure was governance: documented risk that was never converted into a binding decision at the point that mattered.

Why it matters

This is the version of governance analysis I'd bring to a delivery-PMO role: don't accept an optimistic schedule at contract award, and know how to find the exact point where structure stopped producing control.

CASE / 06

Six PMBOK domains, one broken project

6
PMBOK domains diagnosed
Governance, scope, cost, schedule, stakeholders, close-out
$17M
Expansion, no feasibility study
Committed without independent analysis
0
Formal scope baseline or close-out
A systemic breakdown, not one bad call
Context

A ~2,870-word consultancy management report for BUSM1278 (Project Management Practice) on the Woody 2010 case: a custom woodworking company's $17M capacity expansion that collapsed into cost overruns, schedule slippage, and unresolved supplier disputes.

What I did

Applied a PMBOK 6th-edition diagnostic across the full delivery lifecycle, PM authority, stakeholder and communications management, scope, cost, schedule, and project close-out, tracing each failure back to its root governance gap and pairing it with a specific fix: a formal scope statement and change-control board, a communications matrix by audience and frequency, earned-value tracking, and a mandated close-out checklist.

Result

The project hadn't failed from one bad decision, it had never had the basic controls to fail well: no charter, no work breakdown structure, no cost or schedule baseline, no stakeholder register, no close-out review. I delivered a full set of recommendations to rebuild those controls before the next capital project, not after the next failure.

Why it matters

This is the PMBOK toolkit applied end to end rather than module by module, the same lens I'd use to diagnose a struggling program: work backward from the symptom to the missing control, and give the fix an owner.

CASE / 07

Finding the bottleneck in a content engine, not applying Agile by default

3
Root causes isolated
Sequential handoffs, low visibility, late-stage calls
$9.2B
Content-in-production assets
The scale the coordination problem sat inside
Scrum + Kanban
Recommended model
Value-stream mapped, root-cause led
Context

A group project for BUSM4764 (Agile Project Management), graded 82/100, applying Agile and Lean to Netflix's in-house content production, where fragmented, stage-based workflows across creative, production and tech teams were driving delayed releases, missed audience trends, and higher cost and rework.

What I did

Used value-stream mapping and root-cause and bottleneck analysis to locate where the fragmentation actually lived, sequential handoffs, low visibility, and reactive late-stage decisions, then designed the fix: a shared Scrum cadence across creative, production and tech with regular reviews to surface issues earlier, supported by Lean and Kanban for waste elimination and real-time flow visibility.

Result

A staged implementation roadmap, pilot one production team, establish sprints and retrospectives, bring external studios into shared visibility, then scale across content divisions, with success measured on flow, delivery and collaboration metrics rather than on whether teams were simply "doing Agile." Graded 82/100 (High Distinction), backed by an ICAgile ICP certification I earned in the course.

Why it matters

A delivery methodology only earns its place if it's chosen for the bottleneck it fixes, not applied by default. This is that instinct: find the actual constraint first, then match the framework to it.

More write-ups in progress.